
How Web Analytics Drives Business Growth: A Practical Guide

Web analytics turns site behavior into measurable growth by tracking what visitors do, attributing that behavior to specific channels, and running revenue-focused experiments that compound over time. The role of web analytics in growth is not theoretical: it is the feedback loop that tells you which marketing dollars are working, which pages are leaking conversions, and where your next dollar of revenue is most likely to come from.
Two actions to take this week:
- Pick one primary conversion goal (a form submission, a phone call, a purchase) and confirm it is firing correctly in your analytics platform.
- Install or verify a single tracking snippet, then open the real-time report to confirm data is flowing.
What does success look like in the first 30 days? One KPI moving in the right direction. If your conversion rate on the primary goal page ticks up after a single page change, you have proof the system works. That is all you need to build momentum.
Table of Contents
- How does web analytics actually work?
- What are the real strategic benefits of web analytics for growth?
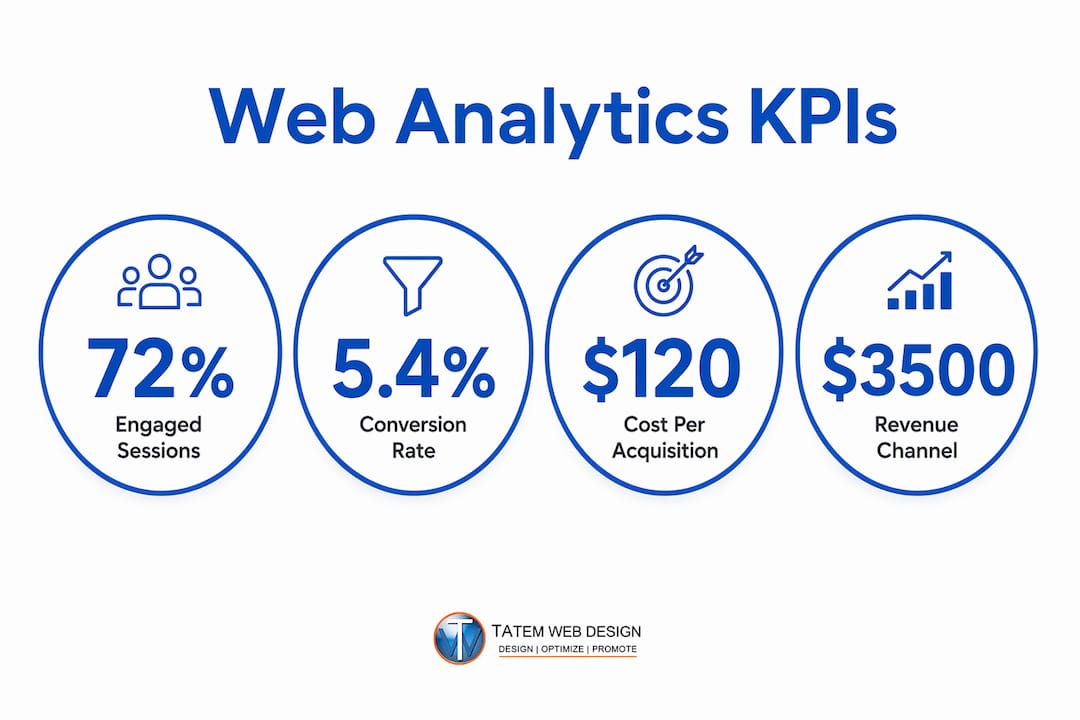
- Which KPIs should you actually track for growth?
- Which analytics tools fit your stack and team?
- How do you turn analytics into measurable growth? A 30/90/180-day playbook
- How do you tie analytics to actual revenue?
- How do you protect data quality and stay compliant?
- What are the most common analytics mistakes and how do you fix them?
- Key Takeaways
- An agency perspective on analytics-driven growth
- Tatemweb builds analytics-ready websites that measure growth from day one
- Useful sources and further reading
- FAQ
How does web analytics actually work?
Web analytics is the practice of collecting, processing, and reporting on visitor behavior to drive better business decisions. The data flow is straightforward once you see it laid out.
A tag or snippet (a small block of JavaScript, or a server-side call) fires when a visitor loads a page or triggers an event. That signal travels to a data collector, where it is processed, sessionized, and stored. The processed data then surfaces in reporting dashboards where you can slice it by channel, device, geography, or behavior.
Web analytics produces the puzzle pieces — what visitors do on your site. Digital marketing analytics assembles those pieces into revenue-driving insights by connecting channels and people to actual business outcomes. The two disciplines overlap but are not the same: web analytics is site-level; digital marketing analytics links that behavior to pipeline and sales.
Collection methods vary by team and budget. Pageview tags fire on every page load. Event tracking captures specific interactions: button clicks, video plays, scroll depth, form submissions. UTM parameters append source, medium, and campaign data to URLs so you can trace a session back to the exact ad or email that drove it. Server-side tagging routes data through your own server before sending it to a platform, which improves accuracy and reduces the impact of ad blockers.
One distinction worth understanding early: session-level data tells you what a group of interactions looked like in aggregate, while user-level data (when privacy rules permit) lets you stitch a journey across multiple visits. Attribution models use UTM data and CRM linkage to credit the right touchpoints with the right conversions.

What are the real strategic benefits of web analytics for growth?
Analytics increases growth by making three things more efficient: how you acquire visitors, how many of them convert, and how long they stay valuable. Each of those levers has a direct dollar value.
- Acquisition efficiency: When you can see which channels deliver the lowest cost per acquisition (CPA), you reallocate budget away from underperformers. A Florida law firm that discovers most of its qualified leads come from organic search, not paid ads, can shift spend accordingly and lower CPA without touching conversion rate.
- Conversion rate improvement: Improving conversion rate increases revenue without buying more traffic. A single landing page fix, validated by analytics, can lift revenue on existing spend. This is the fastest path to ROI for most SMBs.
- Retention and engagement: Analytics surfaces the pages, content types, and sequences that keep customers coming back. Churn analysis starts with identifying where repeat visitors drop off and what behavior precedes cancellation or disengagement.
- Strategic ROI and budget allocation: Attribution data tells you which campaigns actually close revenue, not just which ones generate clicks. That distinction is worth real money when you are deciding where to spend next quarter.
- UX validation: Analytics helps UX teams prioritize issues across traffic, technical, content, and navigation categories, turning gut-feel design decisions into evidence-backed ones.
The connective thread across all five benefits is measurement. Without it, you are optimizing by instinct. With it, every decision has a feedback loop.

Which KPIs should you actually track for growth?
Focus on 5–8 KPIs rather than tracking everything. More metrics mean more noise, more meetings about numbers that do not move revenue, and more time wasted. The table below gives you a practical shortlist.
| KPI | What it measures | Why it matters for growth | Practical guidance |
|---|---|---|---|
| Engaged sessions | Sessions where visitors spend meaningful time or interact | Filters out bounces; shows real interest | Track trend week-over-week, not absolute number |
| Conversion rate (by funnel step) | % of visitors completing a goal at each stage | Pinpoints exactly where the funnel leaks | Segment by channel and device |
| Lead conversion rate | % of site visitors who become leads | Ties traffic directly to pipeline | Compare by traffic source to find best channels |
| Revenue / revenue per session | Total revenue or revenue divided by sessions | The bottom-line growth metric | Use for ecommerce; proxy with lead value for service businesses |
| Traffic by channel | Sessions broken out by organic, paid, direct, referral, email | Shows which acquisition channels are growing | Watch share shifts, not just totals |
| Cost per acquisition (CPA) | Ad spend divided by conversions | If CPA exceeds customer lifetime value, marketing loses money | Set a CPA ceiling before scaling any channel |
| Customer lifetime value (LTV) | Projected revenue from a customer over their relationship | Justifies higher CPA for high-value segments | Pair with CPA to set bidding strategy |
| Average order value (AOV) | Revenue divided by number of orders | Lifting AOV grows revenue without more traffic | Test upsells and bundles on checkout pages |
Pro Tip: For any candidate KPI, ask whether you can attach a dollar value to a one-point improvement. If you cannot answer that question, deprioritize the metric. A KPI that cannot be connected to revenue is a distraction, not a growth lever.
Consistency beats complexity for small businesses. A 15-minute weekly review of these 5–8 metrics gives more usable insight than a monthly deep-dive into 40 reports.
Which analytics tools fit your stack and team?
Choose the simplest tool you will actually use, then add integrations for attribution or session insights as your program matures. The table below covers the five platforms you are most likely to encounter.
| Tool | Best for | Setup complexity | Cost | Data retention / privacy posture |
|---|---|---|---|---|
| GA4 (Google Analytics 4) | SMBs and mid-market teams needing free, full-funnel web analytics | Moderate (tag manager recommended) | Free; GA4 360 is enterprise-priced | Default retention period; GDPR/CCPA consent required; cookieless signals in development |
| Google Tag Manager | Any team deploying and managing multiple tags without code deploys | Low-moderate | Free | No data collection; manages other tags; reduces developer dependency |
| Hotjar | Teams needing session recordings, heatmaps, and on-site surveys to answer “why” | Low | Free tier; paid plans scale by sessions | Session data; GDPR-compliant with consent; no PII in recordings |
| Mixpanel | Product and SaaS teams tracking event-level user behavior and retention | Moderate-high | Free up to 20M events/month; paid above | User-level event history; strong data export; privacy controls configurable |
| Adobe Analytics | Enterprise teams needing cross-channel journey analytics and identity resolution | High | Enterprise contract; not publicly listed | Unlimited retention on contract; robust governance; real-time pathing |
For most Florida SMBs, the practical stack is GA4 plus Google Tag Manager for deployment, with Hotjar added when you need to understand why visitors are not converting. Mixpanel becomes relevant when you have a product or app with meaningful repeat-use behavior. Adobe Analytics enters the picture only when you need person-level stitching across multiple channels and have the infrastructure to act on it.
Pro Tip: Run GA4 alongside a privacy-first tool like Plausible or Fathom if your audience is privacy-sensitive or if you serve European visitors. The two tools will not agree exactly, but the directional signals will be consistent enough to guide decisions.
For GA4-specific setup guidance, understanding GA4 for your business covers the common configuration pitfalls that cause data gaps in the first 90 days.
How do you turn analytics into measurable growth? A 30/90/180-day playbook
The most impactful first action is simple: set one conversion goal and establish its baseline. Everything else builds from that number.
Days 1–30: Instrument and validate
- Deploy Google Tag Manager on every page of your site.
- Create one conversion event (form submit, call click, or purchase) and verify it fires in GA4’s real-time report.
- Set up one dashboard with your 5–8 KPIs (see the table above).
- Validate data quality: check for duplicate pageviews, self-referrals, and missing UTM parameters on paid campaigns.
- Confirm UTM tagging is consistent across all active ad campaigns and email sends.
Days 31–90: Experiment and attribute
- Identify the two or three funnel steps with the largest drop-off.
- Run one A/B test or funnel fix per step. Prioritize pages with the highest traffic and the most revenue at stake. Landing page optimization is often the fastest win.
- Tie experiment results to revenue: did the variant lift conversion rate? What is the estimated revenue impact at current traffic volume?
- Refine channel mix based on CPA vs. LTV. Cut or pause channels where CPA exceeds LTV.
Days 91–180: Integrate and scale
- Connect GA4 to your CRM (HubSpot, Salesforce, or equivalent) using UTM fields and unique identifiers so web leads map to closed revenue.
- Set up automated weekly reports delivered to the team by email or Slack.
- Build a recurring KPI dashboard using the template below.
| KPI | Current value | Target | Owner | Last updated |
|---|---|---|---|---|
| Conversion rate (primary goal) | — | — | Marketing | Weekly |
| CPA by channel | — | — | Paid media | Weekly |
| Lead conversion rate | — | — | Sales | Weekly |
| Revenue / revenue per session | — | — | Analytics lead | Weekly |
| Traffic by channel | — | — | Analytics lead | Weekly |
| Engaged sessions | — | — | Analytics lead | Weekly |
| Customer lifetime value (LTV) | — | — | Finance | Monthly |
| Average order value (AOV) | — | — | Analytics lead | Weekly |
Cost estimate: A minimal DIY setup (GA4, Google Tag Manager, Hotjar free tier) costs nothing in software but requires 8–15 hours of setup and ongoing weekly time. A modest agency engagement for setup, QA, and monthly reporting typically runs in the low-to-mid four figures per month. Enterprise integrations with CRM, server-side tagging, and attribution modeling add significant cost and complexity and are justified only when the revenue at stake is large enough to fund the infrastructure.
How do you tie analytics to actual revenue?
Attribution does not need to be perfect to improve ROI. It needs to be good enough to guide the next budget decision.
The simplest setup that works for most SMBs:
- Last-click with UTM discipline. Every paid and email link carries a UTM. GA4 credits the last non-direct channel. Imperfect, but directionally reliable when UTMs are clean.
- Multi-touch rules-based crediting. GA4’s data-driven attribution model distributes credit across touchpoints based on observed conversion paths. Activate it once you have enough conversion volume (roughly 300+ conversions per month) for the model to be statistically meaningful.
- CRM linkage. Import UTM source, medium, and campaign into your CRM as lead fields. When a deal closes, you can trace it back to the originating channel. This is the step that closes the loop between web behavior and revenue.
- Server-side event flow. For ecommerce or high-value lead gen, route purchase and lead events through a server-side tag to reduce data loss from ad blockers and browser restrictions.
- Test vs. production separation. Always QA attribution changes in a staging environment before pushing to production. A misconfigured attribution model can silently corrupt months of data.
Pro Tip: Invest in advanced attribution modeling or a dedicated attribution vendor only when your monthly ad spend is large enough that a 10–15% misallocation would cost more than the tool. For most SMBs, clean UTMs and CRM linkage deliver 80% of the value at a fraction of the cost.
Tying event ROI to web behavior follows the same logic for offline channels: track the UTM or unique URL that drove event registrations, then close the loop in your CRM when those attendees convert.
How do you protect data quality and stay compliant?
Poor data quality harms decisions faster than missing features do. A single misconfigured tag can inflate conversion counts by 30% and send your team chasing a growth signal that does not exist.
| Governance area | What to check | How often |
|---|---|---|
| Tag verification | Confirm all tags fire correctly using Tag Assistant or GTM preview mode | After every deployment |
| Conversion event QA | Test each conversion event with real and synthetic traffic | Monthly and after site changes |
| Sampling awareness | GA4 standard reports are unsampled; Explore reports may sample at high volumes | Before presenting data to stakeholders |
| Timezone and attribution alignment | GA4 timezone must match your CRM and ad platform timezone | At setup and after any account change |
| PII audit | Confirm no email addresses, names, or phone numbers are captured in event parameters | Quarterly |
| Data retention review | GA4 has a default retention period; settings allow extending for year-over-year comparisons | At setup |
On privacy: U.S. businesses serving California residents must comply with the California Consumer Privacy Act (CCPA), which requires a clear opt-out mechanism for data sale and sharing. If you serve European visitors, GDPR requires explicit consent before setting non-essential cookies. In practice, this means a consent management platform (CMP) that gates analytics tags until the visitor accepts. Server-side tracking and cookieless measurement (GA4’s modeling, first-party cookies) reduce but do not eliminate compliance obligations. Consult legal counsel for your specific situation.
For businesses handling sensitive data, AI-driven cybersecurity compliance can help ensure your analytics pipeline does not inadvertently create a data governance liability.
What are the most common analytics mistakes and how do you fix them?
The most common mistake is tracking too much and acting on noise instead of signal. More events, more dimensions, and more dashboards do not produce more insight. They produce more meetings.
- Vanity metrics without conversion tracking. Pageviews and social followers feel good but do not pay bills. Fix: tie every dashboard metric to a conversion or revenue outcome before adding it.
- Inconsistent UTM tagging. One campaign tagged, three not tagged, and your channel report becomes fiction. Fix: create a UTM naming convention document and enforce it with a shared spreadsheet or a UTM builder tool.
- Overcomplicated dashboards. A 40-metric dashboard is a 40-metric distraction. Fix: collapse to the 5–8 KPI shortlist and schedule a 15-minute weekly review.
- Missing QA after site changes. A developer updates the checkout flow and the purchase event stops firing. Nobody notices for six weeks. Fix: add a tag verification step to your deployment checklist.
- Ignoring qualitative “why” data. Clickstream data tells you what happened; it rarely tells you why. Supplement clickstream with session recordings, on-site surveys, and usability testing to discover user intent. Excessive tracking also slows your site and can harm SEO, so minimal instrumentation is both a data quality and a performance decision.
Pro Tip: When a quantitative metric drops unexpectedly, open Hotjar before you open GA4. Session recordings often reveal the answer in under 10 minutes: a broken form, a confusing CTA, or a mobile layout issue that your desktop testing missed.
Key Takeaways
Web analytics drives measurable growth when you focus on a short KPI list, close the loop between site behavior and revenue, and run disciplined experiments on the highest-impact funnel steps.
| Point | Details |
|---|---|
| Focus on 5–8 KPIs | Tracking 5–8 metrics consistently outperforms monitoring dozens; tie each KPI to a dollar value. |
| Close the attribution loop | Clean UTM tagging plus CRM linkage connects web behavior to closed revenue without expensive tooling. |
| Run the 30/90/180 playbook | Instrument in month one, experiment in month two, integrate and automate by month six. |
| Combine quantitative and qualitative data | Session recordings and surveys answer the “why” that clickstream data alone cannot. |
| Tatemweb implements the full stack | Tatemweb builds analytics-ready AI websites, sets up conversion tracking, and integrates CRM for Florida SMBs. |
An agency perspective on analytics-driven growth
Our approach at Tatemweb centers on revenue-first instrumentation: set up the tracking that connects to dollars before adding any other measurement layer.
One pattern we see repeatedly with service businesses in Florida: the site has GA4 installed, but the primary conversion event (a contact form or a phone call click) is either not tracked or tracked incorrectly. The team is making channel decisions based on traffic volume alone, with no visibility into which visitors actually become clients. When we fix that single instrumentation gap, the channel picture often inverts. Organic search, which looked modest by session count, turns out to drive the majority of qualified leads. Paid social, which looked strong by traffic, converts at a fraction of the rate. Budget shifts follow, and CPA drops without any change to the website itself.
The second pattern: teams that add analytics but never build a weekly review ritual. Data without a decision cadence is just storage. A 15-minute weekly check of the 5–8 KPI shortlist, with one question on the agenda (“what changed and why?”), produces more growth than a quarterly analytics audit.
Tatemweb’s service model integrates analytics from the start of every AI website build. Conversion events are configured before launch, not retrofitted afterward. AI chatbots and lead capture tools feed directly into the attribution pipeline, so every lead has a source. For clients in healthcare, legal, and other regulated industries, our compliance consulting ensures the analytics stack does not create a HIPAA or PCI liability. The result is a site that is not just live but measurable from day one.
Tatemweb builds analytics-ready websites that measure growth from day one
Most agencies hand you a website and leave the measurement to someone else. Tatemweb builds AI-powered websites with conversion tracking, UTM configuration, and CRM integration already in place, so you start collecting growth data the moment the site goes live.
For Florida SMBs, that means no gap between launch and insight. Your AI chatbots and lead capture tools are wired into the attribution pipeline from the start. Your compliance obligations (HIPAA, PCI, CMMC) are addressed before they become a liability. And your team gets a weekly KPI dashboard, not a pile of raw reports.
Tatemweb serves businesses across real estate, healthcare, legal, marine, and professional services throughout Florida. Call 772-224-8118 or visit our AI services page to schedule a consultation and see exactly how an analytics-driven build would work for your business.
Useful sources and further reading
The following sources informed this guide and are worth bookmarking for implementation details and ongoing reference.
- Google Analytics business growth — DigitalSMB: practical KPI guidance for SMBs using GA4.
- How to blend web analytics and digital marketing analytics — HubSpot: explains the distinction between site-level and revenue-level analytics and how to connect them.
- How to use web analytics 2.0 to improve conversions — OptimizeSmart: covers CRO methodology and the role of qualitative data.
- Web analytics for small business — Analytics Alternatives: no-nonsense guide to minimal instrumentation and weekly review habits.
- What is website analytics? — Adobe: covers enterprise journey analytics and cross-channel identity resolution.
- 3 uses for analytics in UX practice — Nielsen Norman Group: explains how analytics and UX research work together.
- California Consumer Privacy Act — California AG: primary source for CCPA compliance obligations.
- GDPR — Wikipedia: overview of GDPR scope and requirements for U.S. businesses with European visitors.
For implementation specifics, consult the official documentation for GA4, Google Tag Manager, and your CRM platform. For compliance questions, work with legal counsel familiar with your industry and jurisdiction.
FAQ
What is the role of web analytics in business growth?
Web analytics drives growth by revealing which channels, pages, and behaviors lead to conversions, allowing teams to allocate budget and effort toward what actually works. The core loop is: track behavior, attribute it to a source, run an experiment, and scale what wins.
How many KPIs should a small business track in GA4?
Focus on 5–8 KPIs such as engaged sessions, conversion rate, lead conversion rate, CPA, revenue by channel, customer lifetime value, average order value, and traffic by channel. Tracking more metrics than that creates noise and slows decision-making without improving outcomes.
What is the difference between web analytics and digital marketing analytics?
Web analytics measures on-site behavior (pageviews, sessions, events). Digital marketing analytics connects that behavior to pipeline and revenue by linking channel data, CRM records, and business outcomes. Most SMBs need both, starting with web analytics and adding CRM linkage as they mature.
How long does it take to see measurable growth from analytics?
With proper instrumentation, most teams see directional insight within 30 days and measurable conversion improvements within 90 days after running their first funnel experiments. The 180-day mark is when CRM integration and automated reporting make the program self-sustaining.
Does Tatemweb help with analytics setup and conversion tracking?
Yes. Tatemweb configures conversion tracking, UTM parameters, and CRM integration as part of every AI website build, so clients have a functioning measurement system from launch day rather than retrofitting it later.
Recommended
Tatem Web Design
26+ YearsWeb Design & SEO Specialist · Tatem Web Design
Matt Tatem has been designing websites professionally since 1999, making Tatem Web Design one of Florida's longest-running web agencies. Based in Stuart, FL, he specializes in WordPress, local SEO, Shopify e-commerce, and cybersecurity consulting for small businesses.

What a CMMC Level 2 Assessment Requires and How to Prepare
Prepare for your CMMC Level 2 assessment by understanding requirements, assessment paths, and mapping your Controlled Unclassified Information.

A Data Retention Policy Is Your Rulebook for Keeping and Deleting Data
Establishing a clear data retention policy helps manage data risk, ensuring compliance and effective data management for your organization.

Law Firm Local SEO: A Practical Playbook for More Local Clients
Unlock more local clients for your law firm with effective local SEO strategies. Optimize your Google Business Profile and boost your visibility!